Introduction
In the last couple of years since about mid-2008 we have seen historically low interest rates in the US, Europe and in the rest of the world as well. Only in 2022 both the FED and the ECB took action to fight the "transitory" inflation by, also historically steep rates hikes with all the intended and unintended consequences unfolding just now.
Why to bother as a layman?
Per-se there is no natural law to price things. Pricing is simply based on supply and demand. Now if there is high supply of one thing, its relative value drops.
Interest rates are the price of money. If interest rates are low, money is worth less and therefore anything on the other side of the trade, especially equities, rise in price.
Hence, rising interest rates lead to falling prices of securities. One of the interesting plots to outline this phenomenon is displayed in the next figure:
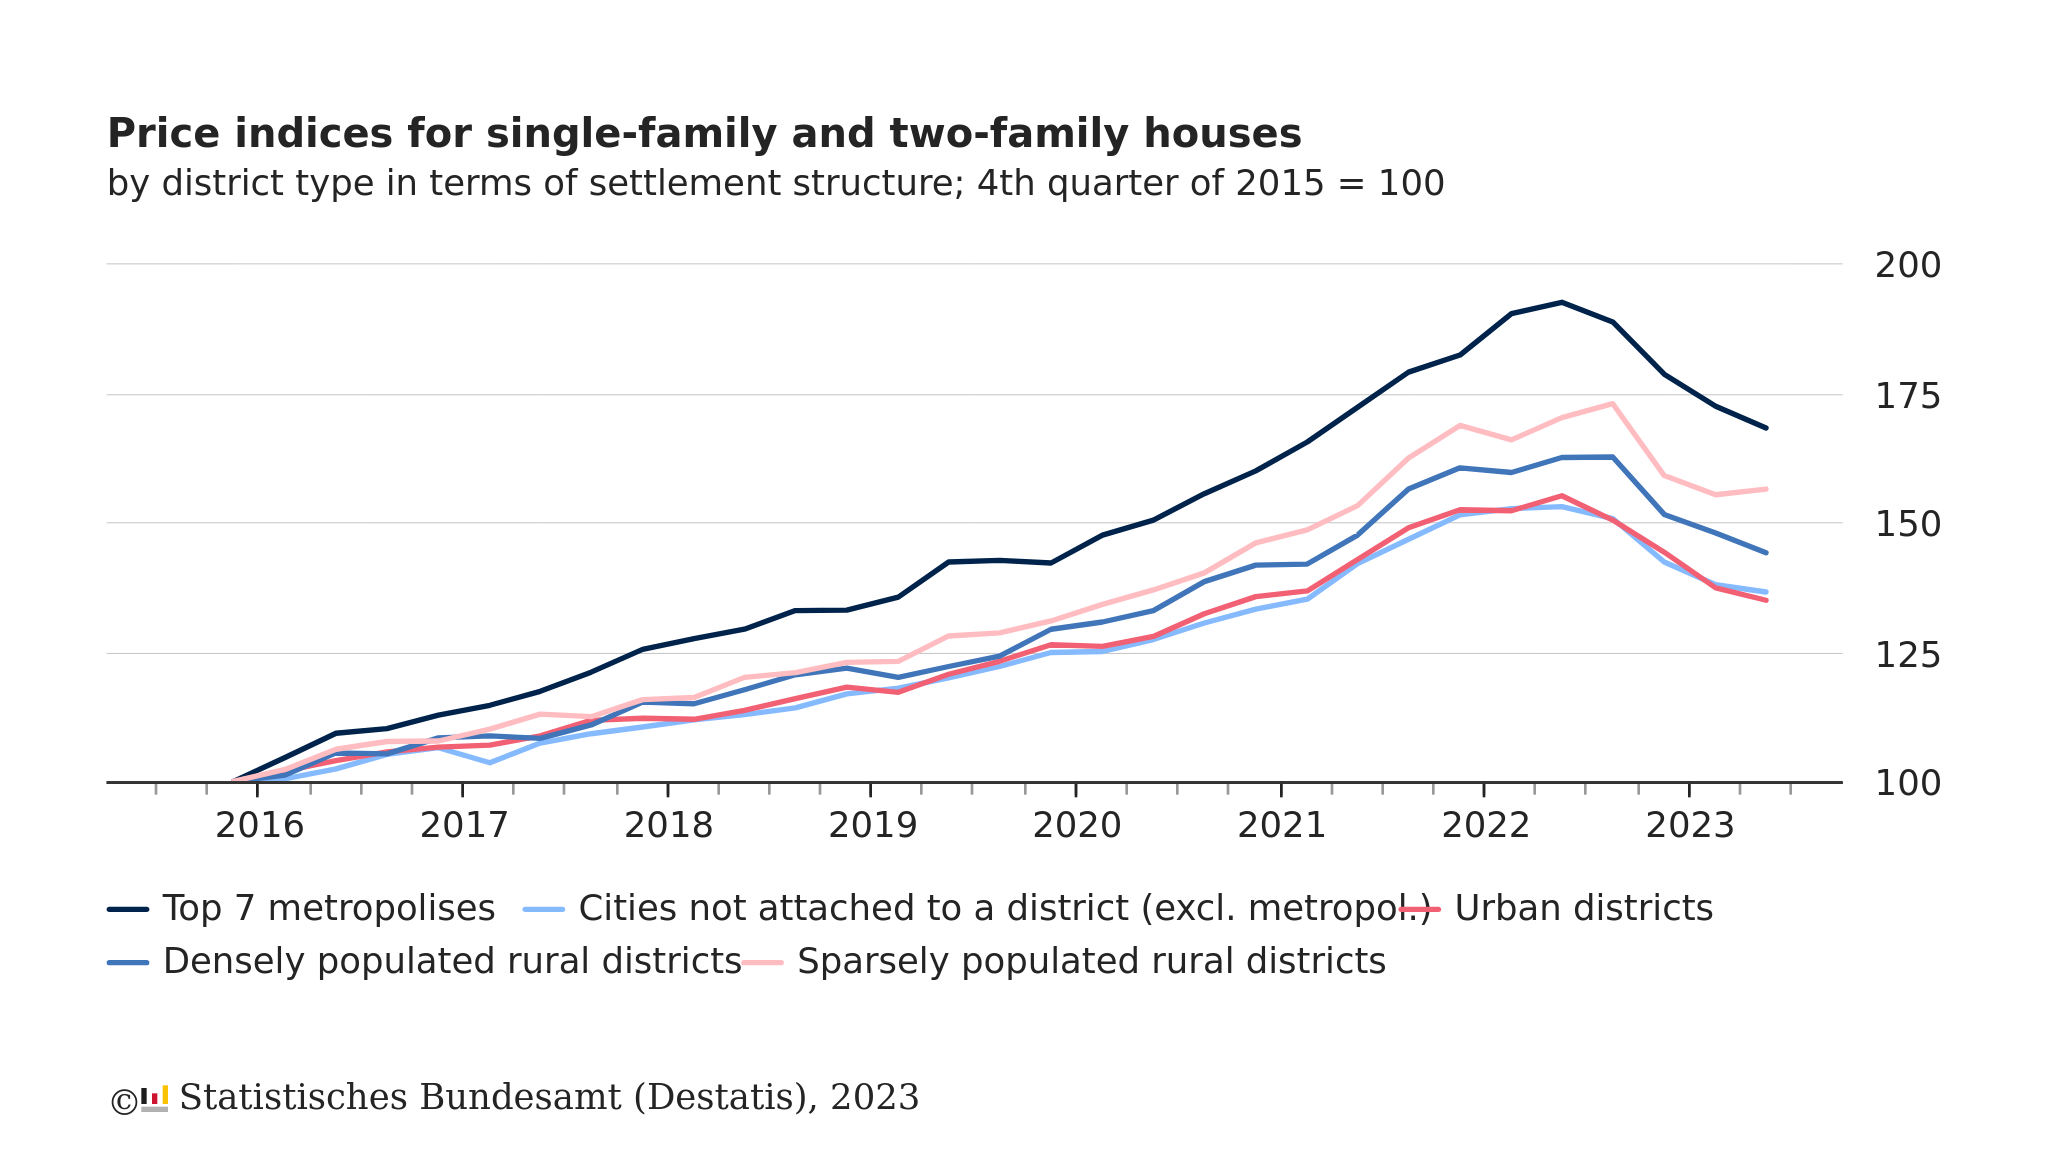
In this figure we can see how the rising rates beginning in mid-2022 significantly affected housing prices after a long boom (bubble?!) phase.
I have often tried to explain this concept to friends and family. But I thought math is better than anything else. So in the next section we shall derive a very simplified equity price model that shows how interest rates affect prices of securities.
The simple mathematical model - derivation
Before we can dive into the model itself we have to build an understanding of pricing of equity securities.
I don't want to go too much into the housing direction because in this sector things are often overshadowed by emotion, or, say, intangible assets I don't understand.
So, let's limit ourselves to equity securities. And we shall do so by inspiration of Warren Buffett and Charlie Munger:
What we take away is that: a business may be simply valued by its future earnings discounted for the current interest rate. If one wants to apply this method to actual investing, a lot more needs to be said and probably understood, see for example on investopedia for the actual "discounted cash flow" approach.
For us, this is good enough to build our simple model.
Let us consider the following expression, in which P is a reasonable price of the security, E's with a subsript i are the earnings in year i and R is the current "interest rate" - be it a treasury yield in frame of opportunity cost evaluations or rates for an investment on leverage. Furthermore, B with a subscript 0 denotes the current book value:
In this formula we have discounted the earnings E by the interest rate that after the first year after buying we have the earnings once discounted for the interest rate. But for the second year the interest rate will not be doubled but the discount applies quadratically, because we would have the same exponential growth for a fixed-income investment or would pay quadratical interest because of compounding interest.
Now we make a little trick and shift the summation into our year (i = 0), such that we have the summation from zero to infinity:
As you can see we needed to substract the first part of the summation, which is simply the earnings from year 0.
With this very simple trick we have almost reached an expression that looks like the geometric series.
What we now need to be able so solve it is a model for the development of the Earnings E. For utmost (over)simplicity, let us say that the earnings of the security are constant for all times. Like an inflation-adjusted Coca-Cola limited to the United States, build to stay forever.
With our simplification for the earnings and usage of the geometric series, we can simplify the equation considerably:
And that's it. The price in our oversimplified model is earnings over interest rate plus book value in year zero.
Let us discuss this finding a little bit.
Discussion
Our oversimplified model shows an inverse proportianility of the price of a security to the assumed interest rate. That means, our model says that prices go to infinity and beyond if interest rates approach zero. And this is what we have seen in the housing price example.
Let us even make some some simplifications. Assume that we have zero book value. Then, we find a very handy expression for the famous P/E ratio, the price devided by earnings:
Yes, that is right. The derived P/E ratio of a security in our model is simply the inverse interest rate. Therefore, interest rates are (one of) the main gauge for equity security pricings! No wonder interest rates are considered the gravitational field of the stock market.
Let us be a little more specific and have a look at a huge bunch of securities within the United States S&P 500 index.
As of today, October 30th 2023, the S&P 500 shows a P/E ratio in the order of 25 [multpl.com]. This implies an interest rate (or, say, expectable return) of around 4%. The 10 year treasury is somewhat short of 5% today [CNBC]. Since the S&P 500 has a lower yield / implied interest rate than the 10 year treasury, market participants are somewhat optimistic about future rising earnings.
Let us put this into context. Historically, the S&P 500 P/E ratio is in the order of 19, its median around 18 gurufocus, which implies an interest rate of roughly 5,5%. This is quite close to the historical 10-year treasury rate yield of 5,9% ycharts.
Interestingly, the historical 10 year treasury yield appears to be slightly above the historical average of the implied P/E = 1/R rate of the S&P 500. Hence, investors in US securities have been historically quite optimistic about the countries future economic outlook by accepting more risk due to highly valued equity securities vs. treasuries.
We shall not go into too much detail about these numbers. They just hint to a presumably more complicated correlation of interest rates and prices of securities. Hence, even though our model was pretty much oversimplified, it provides some course understanding of the relation between pricing of securities and interest rates.
Note again that the model was just to demonstrate the tight (inverse) correlation between prices of equity securities and interest rates. The model is very much oversimplified, does not consider risks and should not be taken to consider any kind of investment, it is a toy model.